In this glossary we are going to put some words that are frequently used in the Industrial Engineering
Analysis
Verb
Detailed examination of the elements or structure of something.
Example: These values are analyzed using a probability distribution for the activity.
en: Análisis
Brainstorming
Phrase
It is a group work tool that facilitates the emergence of new ideas on a specific issue or problem.
Example: We need to do a brainstorming to come up with a new plan.
en: Lluvia de ideas
Cause - Effect Diagram
Noun
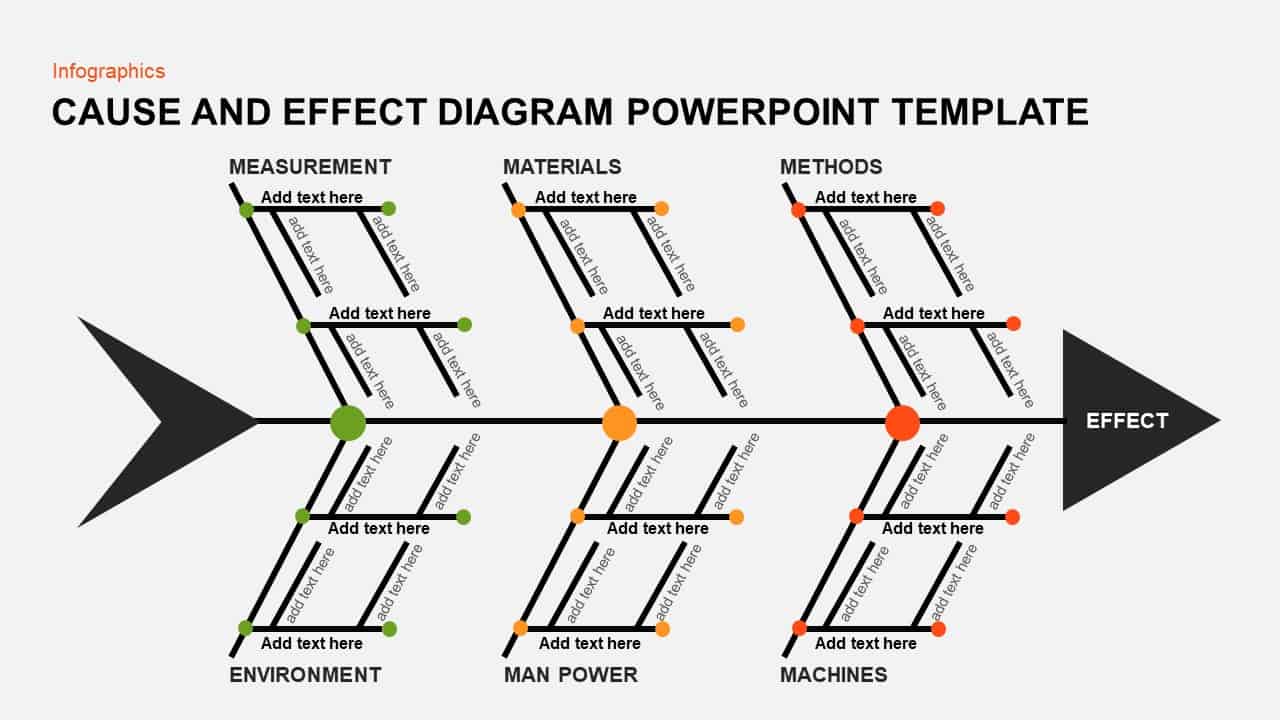
Is a graphical representation showing the relationship qualitative and hypothetical of the various factors that may contribute to a particular effect or phenomenon.
Example: We need to make the cause-effect diagram as a team.
en: Diagrama Causa-Efecto
Causes
Noun
They are responsible for the existence of a problematic situation (phenomenon) that has to be resolved.
Example: Identify the main causes and include them in the diagram
en: Causas
Critical Route
Noun
Represents the minimum time necessary for the development of the project, this being the longest trajectory from start to finish. (On the PERT diagram)
Example: There can be more than one critical route in the diagram.
en: Ruta Crítica
Deficiencies
Adjective
The quality or state of being defective or of lacking some necessary quality or element.
Example: Deficiencies were found in the project that need to be fixed.
en: Deficiencias
Design
Verb
A plan or drawing produced to show the look and function or workings of a building, garment, or other object before it is built or made.
Example: We need to design a new working plan at the end of the month.
en: Diseñar
Execution
Verb
The carrying out or putting into effect of a plan, order, or course of action.
Example: Estimate the start and end time required for the execution of each action.
en: Ejecución
Fictional Activities
Noun
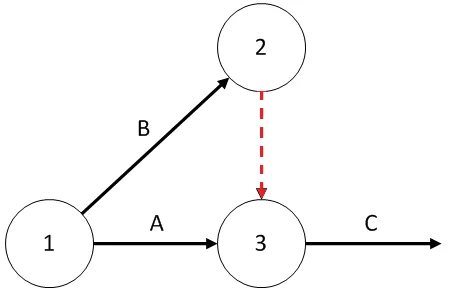
These refer to all activities that do not consume time or cost and are represented by dotted lines.
Example: Fictional activities are used to indicate provenance or dependency since two activities cannot be represented by the same node.
en: Actividades Ficticias
Flowchart
Noun
A diagram of the sequence of movements or actions of people or things involved in a complex system or activity.
Example: The next flowchart represents the steps of the project.
en: Diagrama de Flujo
Gantt Diagram
Noun
Matrix where activities are located, scheduled time to carry them out and responsible for compliance with the same.
Example: We use the Gantt diagram to monitor the fulfillment of a project in the time.
en: Diagrama de Gantt
Graph
Noun
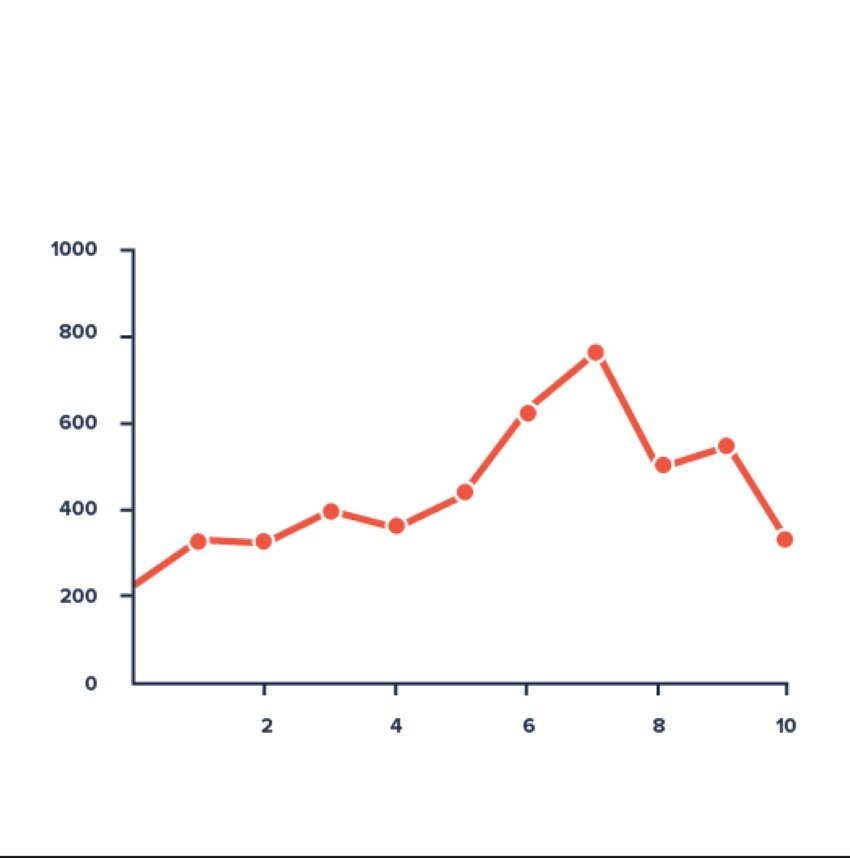
A diagram showing the relation between variable quantities, typically of two variables, each measured along one of a pair of axes at right angles.
Example: In the graph we represent the different durations of each activity.
en: Gráfico
Interpret
Verb
Explain the meaning of (information, words, or actions).
Example: Define the basic rules for the correct construction and interpretation of the diagrams.
en: Interpretar
Leisure Time
Noun
Time when one is not working or occupied; free time.
Example: What is the percentage of leisure time?
en: Tiempo ocioso
Matrix
Noun
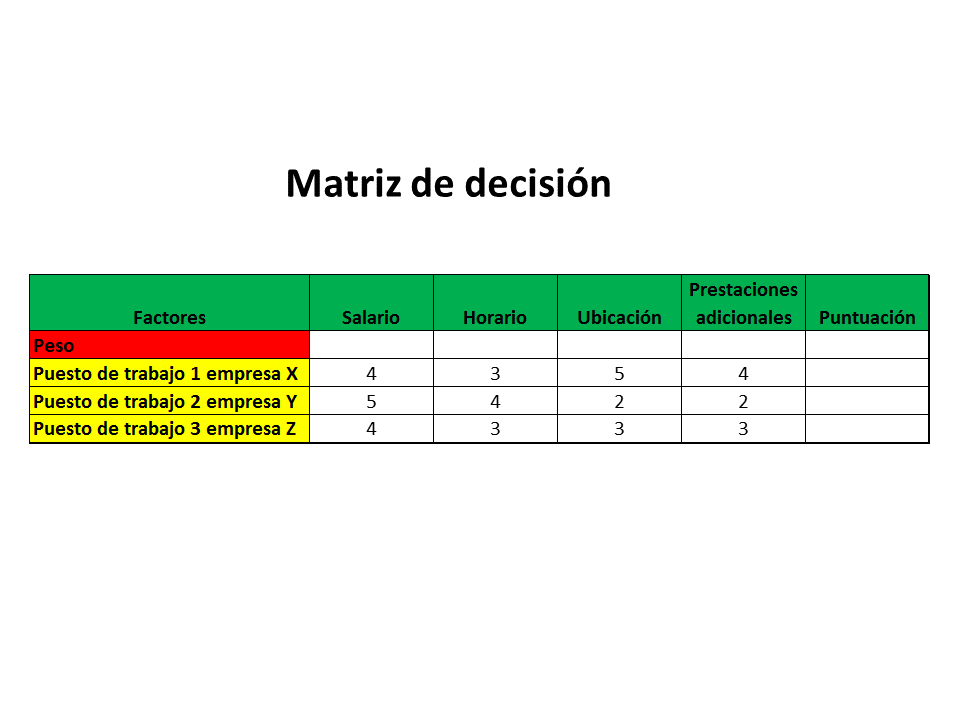
Is a rectangular array of numbers, symbols, or expressions, arranged in rows and columns.
Example: In the matrix the programmed activities are located.
en: Matriz
Metallurgy
Noun
The branch of science and technology concerned with the properties of metals and their production and purification.
Example: Metallurgy has been of great help for a long time, in the development of artifacts and tools.
en: Metalurgia
Method
Noun
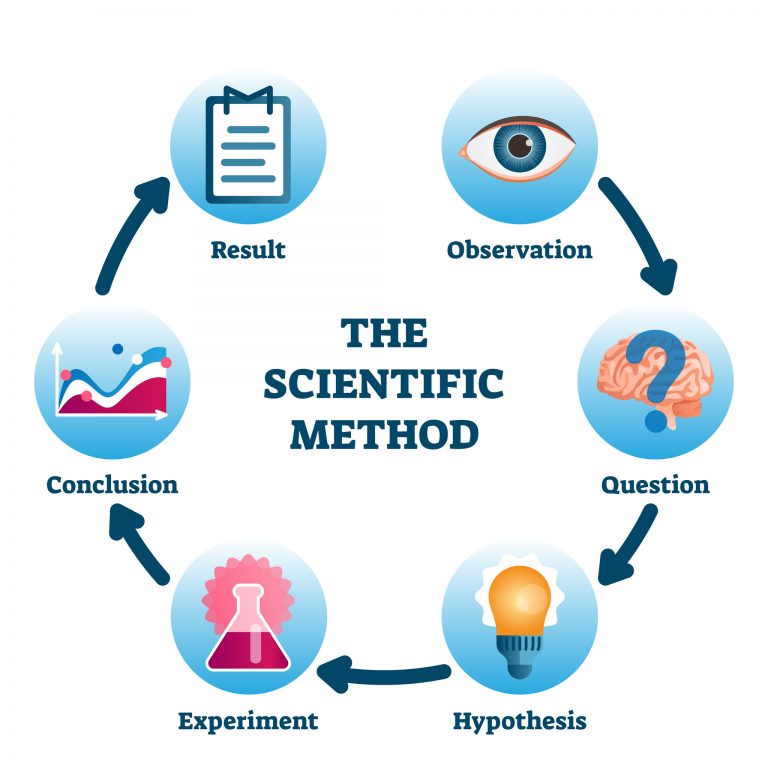
A particular form of procedure for accomplishing or approaching something, especially a systematic or established one.
Example: In order to develop a better method for executing the work, it is necessary to consider the answers
obtained.
en: Método
Nodes
Noun
In a PERT diagram, nodes are used to represent the different elements of a group of operations, and they are also used to record the beginning and end of the time required to execute one or more activities.
Example: All activities are connected between nodes and are represented by a line called arc.
en: Nodos
Pareto Chart
Noun
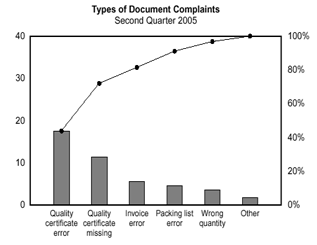
It consists of a bar graph that classifies the causes or factors detected around a phenomenon from left to right in descending order.
Example: The Pareto Chart is used for the study of recent implementations or changes (how was it before - how is it after)
en: Diagrama de Pareto
PERT diagram
Noun
This is a widely used tool for the evaluation and control of projects, which graphically expresses different paths or routes to achieve a goal.
Example: The PERT diagram is the critical route method.
en: Diagrama de PERT
Phenomenon
Noun
It is the problematic situation to which a solution is sought in the Pareto diagram.
Example: There are no specific steps depending on the phenomenon that is analyzed with the diagram.
en: Fenómeno
Production System
Noun
It refers to a series of organized, related and interacting elements, ranging from machines, people, materials, and even to procedures and management style.
Example: The main objective of an effective plant distribution is to develop a production system that allows the manufacture of the desired number of products,
en: Sistema de Producción
Schedule
Noun
A plan for carrying out a process or procedure, giving lists of intended events and times.
Example: It is used in the representation of projects as a schedule of activities.
en: Cronograma
Slack
Noun
Temporary flexibility of activities outside the critical route; which does not affect the duration of the project, in the PERT diagram.
Example: The slack is equal the difference between late start and early start and the difference between late finish and early finish.
en: Holgura
Tools
Noun
A device or implement used to carry out a particular function.
Example: The result of using this tool is an ordered diagram of possible causes (theories) that contribute to an effect.